


















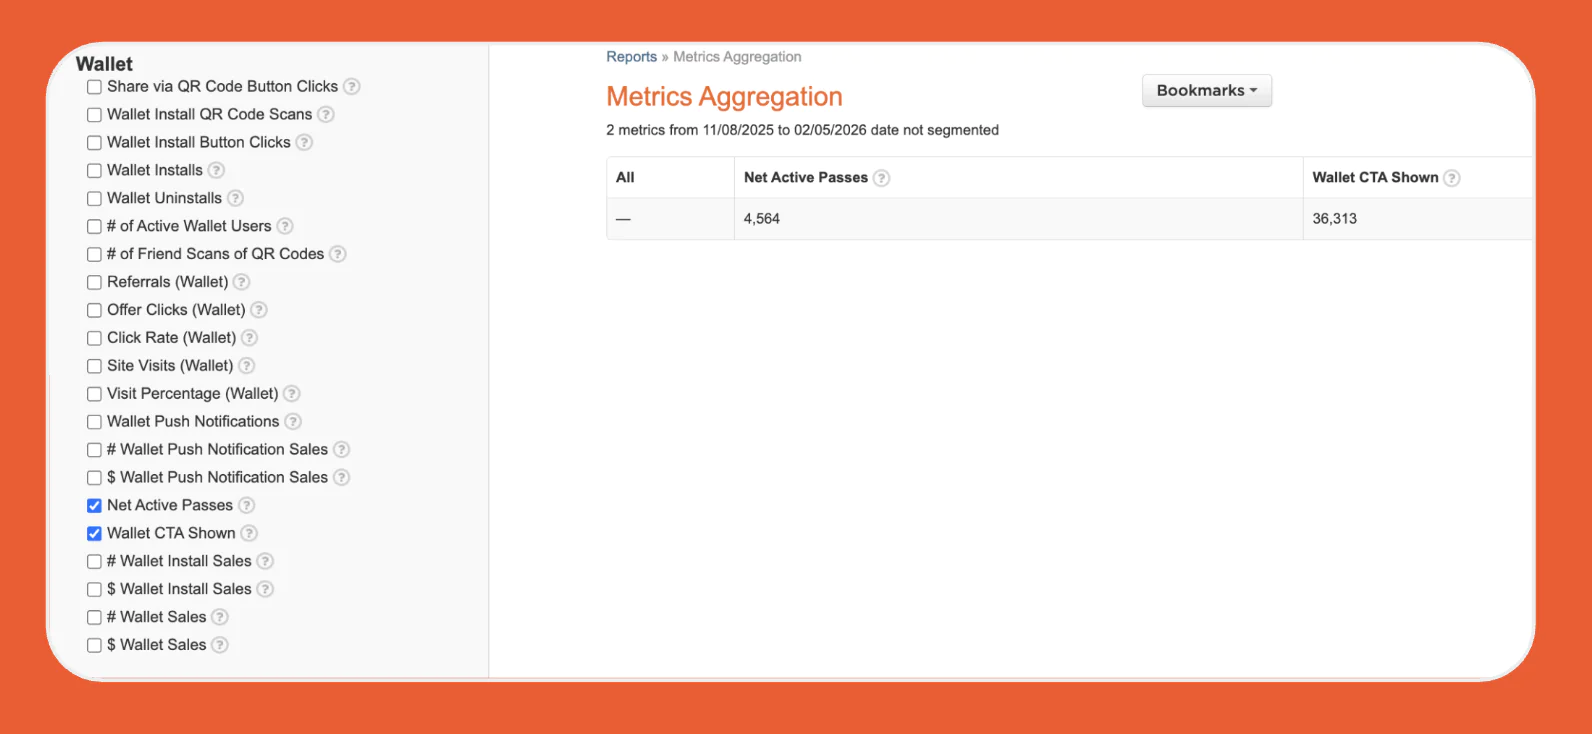
The Problem: Marketers were flying blind at key stages of the Wallet adoption journey. While installs and redemptions were trackable, there was no way to measure how many users actually saw the Wallet CTA—or how many passes remained actively installed over time. This gap made it tough to diagnose drop-offs or optimize for growth.
We’ve just added two game-changing metrics to the Wallet section of MAR:
- Wallet CTA Shown
- Net Active Passes
Together, they illuminate the full Wallet conversion funnel—from the very first CTA impression to retained, actively installed Wallet passes.
How It Works
📊 Wallet CTA Shown
- Fires when the Wallet install CTA is rendered on:
- Share Page
- Claim Page
- Reward Emails (logged on open if CTA was present)
- Filters out bot traffic and sample data
📈 Net Active Passes
- Counts all Wallet passes installed during the selected period
- Excludes uninstalls that occurred before the period ended
Why It Matters
These metrics deliver the full story of Wallet engagement:
- Measure awareness: Understand how often users are actually seeing the Wallet CTA.
- Quantify adoption: Accurately size your active Wallet user base.
- Optimize with confidence: Identify where users drop off in the funnel and refine your strategy.
Whether you’re A/B testing CTA placement or reporting on loyalty pass adoption, these insights put real power in your hands.
Always Be Evolutionating
Your growth strategy deserves data that tells the whole truth. With Wallet CTA Shown and Net Active Passes now live, you can make smarter decisions, faster—and keep your referral and loyalty programs ahead of the curve.
See How We Can Help Your Brand Grow
Learn how Talkable's referral and loyalty platform drives measurable revenue for 1000+ ecommerce brands.
Let's Talk →